Simple Bubble Chart in D3.js
Quick guide on getting a simple bubble chart set up in D3.js.
Contents
- Before We Go Further
- Getting Started with D3
- Breaking the JavaScript of our Bubble Chart
- Follow Up: January 9, 2024
Before We Go Further
I wanted to start by saying I followed this video by Jonathan Soma on YT to make this chart. I tried to work with some examples of code I had found on the D3 site but was quickly overwhelmed. The video I linked to explains things reasonably well to where I understand what’s happening now.
Also, if you’re the type that wants to see the result first, behold the glory of my bubble chart!
Getting Started with D3
Before we can start writing our JS, we need a few things:
- D3 library
- Some data (I have a CSV of bogus data)
- A div (or other element) with a unique id to add our chart into
So we add
scripttag to the head of our HTML that points to any publicly hosted version of D3 v4.11, we mock some data in a CSV and we add an id of “chart” to our div. Now we’re ready to get started writing our JS.
Breaking the JavaScript of our Bubble Chart
First, we’re going to wrap everything in an IIFE (immediately invoked function expression) for easy packaging. It’s going to prevent the variables from being hoisted. In this example we probably don’t care - there’s no sensitive data to speak of - but it was in the video I followed so I went with it.
Anyway, we have an IIFE and we’ll assign a few variables: height, width, and svg.
let width = window.innerWidth,
  height = window.innerHeight;

let svg = d3
  .select("#chart")
  .append("svg")
  .attr("height", height)
  .attr("width", width)
  .append("g")
  .attr("transform", "translate(0, 0)");
The height and width are self-explanatory, but the svg is kind of neat and follows familiar DOM manipulation patterns in Vanilla JS. Once I realized that, it clarified things a lot. Anyway, we find the HTML element we want (the div with id=“chart”), and we append an svg element. We then give that svg some attributes. That SVG gets a g element appended to it. That g is like a container for the chart elements we’ll render out later on.
Great, now we have an svg in our parent div, and a g in our svg that will hold our child elements. We now need a set of rules for how we will display our bubbles and how they should behave. And, jeez we don’t have any data yet! Lots to do, so let’s set some more rules.
// defines the maximum values (domain) and maximum radius values (range) for our cirlces

let radiusScale = d3.scaleSqrt().domain([10, 3000]).range([10, 80]);

// summarizes the forces we want to create to tell our circles how to behave

let simulation = d3
  .forceSimulation()
  .force("x", d3.forceX(width).strength(0.01))
  .force("y", d3.forceY(height).strength(0.01))
  .force(
    "collide",
    d3.forceCollide(function (d) {
      return radiusScale(d.cost) + 1;
    })
  );
As you can see in the comments above, radiusScale defines the rules we use to display circles/bubbles by telling it what our min and max values ARE in our data and what they SHOULD BE on the page. Simulation takes a bit more explaining, really more than I can provide, but the short answer is that it’s an object that D3 creates that has a bunch of functions we can use later. Neato. Here’s what it looks like if we console.log it out…
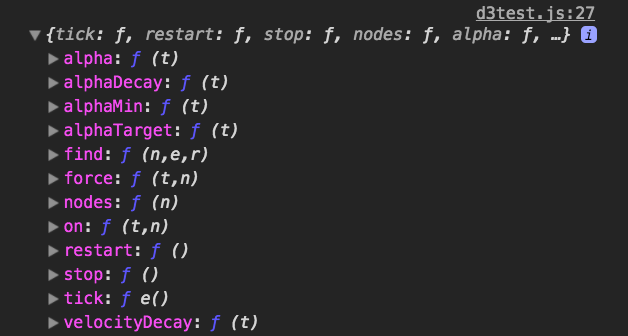
More broadly, the simulation object is going to simulate forces acting on our bubbles. You can see in each of the .force lines, we give a name and then we tell the code what kind of force we want to simulate. We have three here:
- an X force
- a Y force
- a collision force
These all map to positions of our bubbles with respect to the page and with respect to each other. A quick note: the .strength chain method determines how quickly the bubbles move across the screen on load.
Now we’re getting to the good stuff - actually showing some bubbles. To do that we’re going to write a couple of functions and use some D3 methods.
d3.queue().defer(d3.csv, "./data.csv").await(ready);Here we tell D3 to perform actions in a specific order using the .queue method. To use the language from the documentation, the queue method “evaluates zero or more deferred asynchronous tasks with configurable concurrency: you control how many tasks run at the same time.” That means we can control when things happen. If there were an external API call for instance, we could defer rendering until we had data or some errors to work on.
In our case, we queue up getting our data from our locally-stored CSV and then we will run the callback we gave to the .await method - the ready function.
function ready (error, datapoints) {
  let circles = svg.selectAll(".expenses")
    .data(datapoints)
    .enter().append("circle")
    .attr("class", "expenses")
    .attr("r", function(d){
      return radiusScale(d.cost)
    })
    .attr("fill", "lightblue")
We add that function and BOOM… wait, what? Our circles are trapped in the top left corner! See, the issue right now is that even though we have our simulation, we aren’t using it. So we need to call it in our ready function.
simulation.nodes(datapoints).on("tick", ticker);

function ticker() {
  circles
    .attr("cx", function (d) {
      return d.x;
    })
    .attr("cy", function (d) {
      return d.y;
    });
}
Here we write another function, our ticker, which will update the x and y coordinates of our circles as the simulation is run. And that’s it! Thanks for stopping by :)
Follow Up: January 9, 2024
It’s worth noting that D3 pulled out d3.queue into its own repo around version 5 (it’s up to 7.8.5 right now!) because it has alternate means of handling async work like loading a CSV -d3.csv - or using a timer.
I’ve been moving the site here from Jekyll to Astro recently and figured it’s worth sharing that this isn’t the way I’d make the bubble chart anymore. I’ll add a little more content here soon to flesh out how this could work with the D3 in 2024.